
Key figures
- Declared field area
- 35,386 ha 2026
- Share
- 1.3% of national agricultural area
Development in Denmark
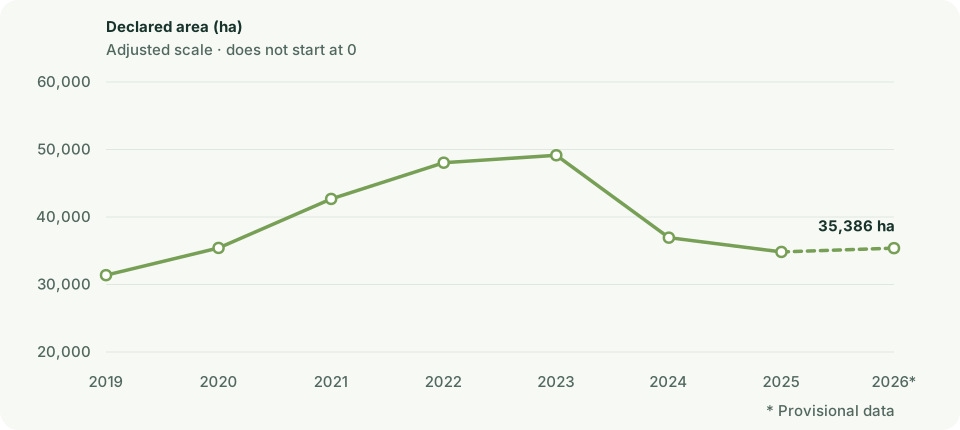
| Year | Declared field area | Share |
|---|---|---|
| 2019 | 31,384.3 ha | 1.2% |
| 2020 | 35,417.7 ha | 1.3% |
| 2021 | 42,677.6 ha | 1.6% |
| 2022 | 48,043.7 ha | 1.8% |
| 2023 | 49,144.9 ha | 1.8% |
| 2024 | 36,939.8 ha | 1.4% |
| 2025 | 34,824.5 ha | 1.3% |
| 2026 | 35,385.6 ha | 1.3% |
Municipalities with the largest area
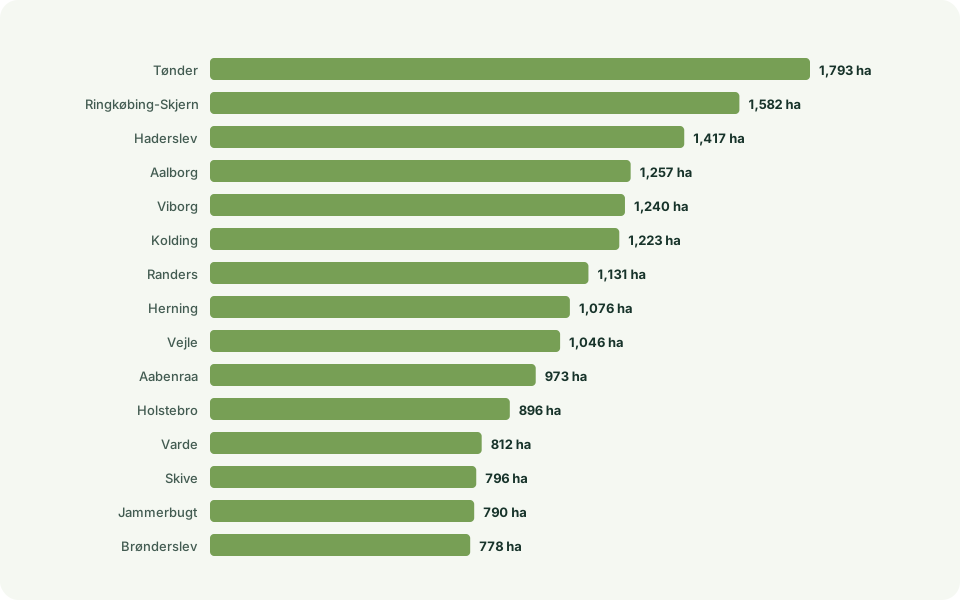
| Rank | Municipality | Declared field area |
|---|---|---|
| 1 | Tønder | 1,793.1 ha |
| 2 | Ringkøbing-Skjern | 1,582.1 ha |
| 3 | Haderslev | 1,417.3 ha |
| 4 | Aalborg | 1,257.1 ha |
| 5 | Viborg | 1,240.2 ha |
| 6 | Kolding | 1,223.2 ha |
| 7 | Randers | 1,131 ha |
| 8 | Herning | 1,075.5 ha |
| 9 | Vejle | 1,046.3 ha |
| 10 | Aabenraa | 973.5 ha |
View all 80 municipalities
| Rank | Municipality | Declared field area |
|---|---|---|
| 1 | Tønder | 1,793.1 ha |
| 2 | Ringkøbing-Skjern | 1,582.1 ha |
| 3 | Haderslev | 1,417.3 ha |
| 4 | Aalborg | 1,257.1 ha |
| 5 | Viborg | 1,240.2 ha |
| 6 | Kolding | 1,223.2 ha |
| 7 | Randers | 1,131 ha |
| 8 | Herning | 1,075.5 ha |
| 9 | Vejle | 1,046.3 ha |
| 10 | Aabenraa | 973.5 ha |
| 11 | Holstebro | 896 ha |
| 12 | Varde | 811.9 ha |
| 13 | Skive | 795.7 ha |
| 14 | Jammerbugt | 789.6 ha |
| 15 | Brønderslev | 777.6 ha |
| 16 | Thisted | 765.3 ha |
| 17 | Hedensted | 748 ha |
| 18 | Faaborg-Midtfyn | 743 ha |
| 19 | Sønderborg | 740.2 ha |
| 20 | Syddjurs | 642 ha |
| 21 | Mariagerfjord | 603.1 ha |
| 22 | Vesthimmerlands | 598.8 ha |
| 23 | Favrskov | 581.6 ha |
| 24 | Assens | 566.3 ha |
| 25 | Vejen | 553.3 ha |
| 26 | Norddjurs | 538.7 ha |
| 27 | Hjørring | 510.7 ha |
| 28 | Holbæk | 479.9 ha |
| 29 | Rebild | 476.4 ha |
| 30 | Silkeborg | 467 ha |
| 31 | Guldborgsund | 465.4 ha |
| 32 | Stevns | 451.3 ha |
| 33 | Nyborg | 447.4 ha |
| 34 | Lemvig | 438.5 ha |
| 35 | Middelfart | 410.6 ha |
| 36 | Svendborg | 406.6 ha |
| 37 | Horsens | 377.9 ha |
| 38 | Bornholm | 372.7 ha |
| 39 | Nordfyns | 360.2 ha |
| 40 | Kalundborg | 340.9 ha |
| 41 | Struer | 329.3 ha |
| 42 | Odder | 320.1 ha |
| 43 | Ikast-Brande | 301.1 ha |
| 44 | Frederikshavn | 293.2 ha |
| 45 | Vordingborg | 284 ha |
| 46 | Esbjerg | 267.7 ha |
| 47 | Langeland | 254.9 ha |
| 48 | Slagelse | 253.4 ha |
| 49 | Næstved | 245.8 ha |
| 50 | Lolland | 236.2 ha |
| 51 | Morsø | 233.1 ha |
| 52 | Skanderborg | 231.7 ha |
| 53 | Odense | 229.2 ha |
| 54 | Billund | 205.7 ha |
| 55 | Aarhus | 202.8 ha |
| 56 | Roskilde | 184.5 ha |
| 57 | Faxe | 161.7 ha |
| 58 | Køge | 141.2 ha |
| 59 | Samsø | 121.9 ha |
| 60 | Kerteminde | 117.8 ha |
| 61 | Frederikssund | 116.2 ha |
| 62 | Odsherred | 92.9 ha |
| 63 | Lejre | 89.7 ha |
| 64 | Ishøj | 82.9 ha |
| 65 | Sorø | 74.5 ha |
| 66 | Gribskov | 69.8 ha |
| 67 | Høje-Taastrup | 69.7 ha |
| 68 | Fredericia | 45.9 ha |
| 69 | Hillerød | 45.4 ha |
| 70 | Ringsted | 45.2 ha |
| 71 | Egedal | 33.7 ha |
| 72 | Solrød | 27.7 ha |
| 73 | Helsingør | 20.6 ha |
| 74 | Halsnæs | 16.3 ha |
| 75 | Læsø | 16.3 ha |
| 76 | Fredensborg | 15.8 ha |
| 77 | Ærø | 10.9 ha |
| 78 | Furesø | 0.6 ha |
| 79 | Ballerup | 0.4 ha |
| 80 | Dragør | 0.3 ha |
Municipalities with the largest share
Shares are compared only for municipalities with at least 500 ha and 100 fields.
| Rank | Municipality | Share |
|---|---|---|
| 1 | Ishøj | 8.1% |
| 2 | Kolding | 3.2% |
| 3 | Stevns | 2.6% |
| 4 | Haderslev | 2.5% |
| 5 | Nyborg | 2.4% |
| 6 | Høje-Taastrup | 2.4% |
| 7 | Middelfart | 2.2% |
| 8 | Sønderborg | 2.2% |
| 9 | Randers | 2.2% |
| 10 | Odder | 2.1% |
View all 78 municipalities
Method and caveats
How the figures are calculated
Declared area is allocated by proportional overlap and largest remainder. A field is counted once in the municipality containing its largest overlap.
Effective crop diversity is exp(Shannon), calculated from classified area in the broad editorial crop groups.
All years use the pinned 2026 DAGI municipality boundaries. The national figure is calculated from unique fields and is not the sum of municipalities.
The crop groups are openlanddata presentation groups, not an official SGAV classification.
The figures describe aggregate declared areas for each year and cannot be used to track crop rotation on individual fields.
Sources and terms
Use the data yourself
CC0 1.0 · You may copy, adapt and share the data, including commercially. Credit is good practice, but is not required by CC0.
Suggested credit: SGAV, Marker
CC0 is documented in the official catalogue for the WFS layer. Its application to the matching ZIP file has not been separately confirmed.
Terms reviewed: 2026-09-07. Processing and calculations: openlanddata.Use the data yourself
CC BY 4.0 · You may copy, adapt and share the data, including commercially. Credit the source, link the licence and describe your changes.
Attribution: Klimadatastyrelsen · DAGI · CC BY 4.0
Municipal snapshot retrieved on 15 July 2026. Boundaries and municipality assignment are used in our calculations.
Terms reviewed: 2026-09-07. Processing and calculations: openlanddata.crop-pulse-collection:marker:3ea695a370bbe768c077dcbfdb3f248ef34aee0154bdca56812df0c2f156ac99