
Top 15
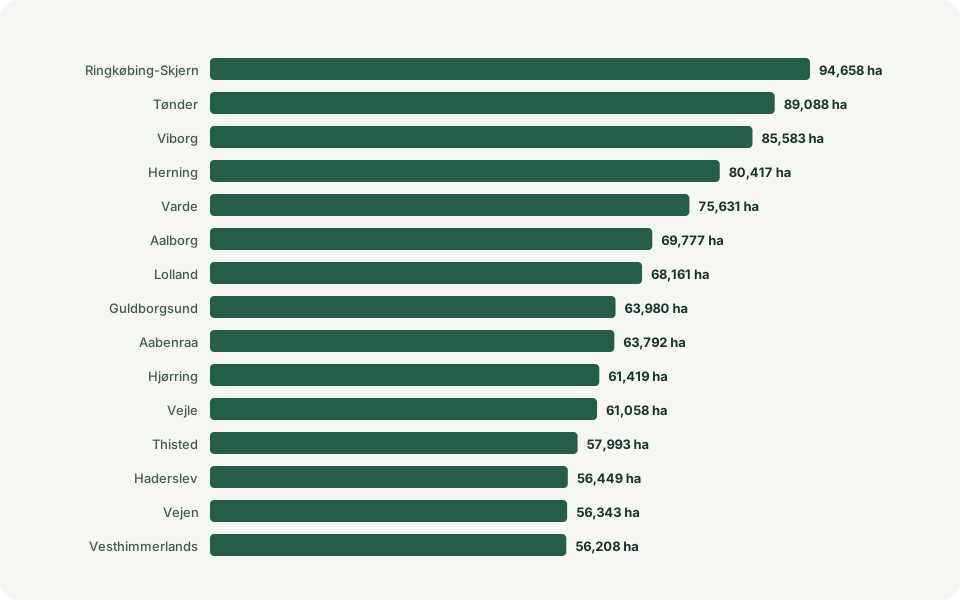
Municipality rankings
| Rank | Municipality | Value |
|---|---|---|
| 1 | Ringkøbing-Skjern | 94,658 ha |
| 2 | Tønder | 89,088 ha |
| 3 | Viborg | 85,583 ha |
| 4 | Herning | 80,417 ha |
| 5 | Varde | 75,631 ha |
| 6 | Aalborg | 69,777 ha |
| 7 | Lolland | 68,161 ha |
| 8 | Guldborgsund | 63,980 ha |
| 9 | Aabenraa | 63,792 ha |
| 10 | Hjørring | 61,419 ha |
View all 90 municipalities
| Rank | Municipality | Value |
|---|---|---|
| 1 | Ringkøbing-Skjern | 94,658 ha |
| 2 | Tønder | 89,088 ha |
| 3 | Viborg | 85,583 ha |
| 4 | Herning | 80,417 ha |
| 5 | Varde | 75,631 ha |
| 6 | Aalborg | 69,777 ha |
| 7 | Lolland | 68,161 ha |
| 8 | Guldborgsund | 63,980 ha |
| 9 | Aabenraa | 63,792 ha |
| 10 | Hjørring | 61,419 ha |
| 11 | Vejle | 61,058 ha |
| 12 | Thisted | 57,993 ha |
| 13 | Haderslev | 56,449 ha |
| 14 | Vejen | 56,343 ha |
| 15 | Vesthimmerlands | 56,208 ha |
| 16 | Jammerbugt | 52,873 ha |
| 17 | Randers | 51,532 ha |
| 18 | Esbjerg | 51,294 ha |
| 19 | Skive | 48,290 ha |
| 20 | Holstebro | 47,593 ha |
| 21 | Mariagerfjord | 45,380 ha |
| 22 | Brønderslev | 45,188 ha |
| 23 | Rebild | 44,250 ha |
| 24 | Norddjurs | 43,789 ha |
| 25 | Næstved | 43,693 ha |
| 26 | Vordingborg | 41,473 ha |
| 27 | Faaborg-Midtfyn | 40,258 ha |
| 28 | Silkeborg | 39,949 ha |
| 29 | Ikast-Brande | 39,789 ha |
| 30 | Syddjurs | 38,888 ha |
| 31 | Kalundborg | 38,495 ha |
| 32 | Kolding | 38,178 ha |
| 33 | Slagelse | 37,642 ha |
| 34 | Holbæk | 36,976 ha |
| 35 | Hedensted | 36,505 ha |
| 36 | Favrskov | 35,231 ha |
| 37 | Bornholm | 34,376 ha |
| 38 | Frederikshavn | 34,039 ha |
| 39 | Sønderborg | 33,475 ha |
| 40 | Lemvig | 33,059 ha |
| 41 | Assens | 33,036 ha |
| 42 | Nordfyns | 31,947 ha |
| 43 | Billund | 31,479 ha |
| 44 | Horsens | 30,007 ha |
| 45 | Morsø | 28,002 ha |
| 46 | Svendborg | 25,708 ha |
| 47 | Faxe | 24,942 ha |
| 48 | Skanderborg | 23,192 ha |
| 49 | Aarhus | 21,959 ha |
| 50 | Langeland | 20,795 ha |
| 51 | Odsherred | 18,841 ha |
| 52 | Ringsted | 18,830 ha |
| 53 | Nyborg | 18,545 ha |
| 54 | Middelfart | 18,353 ha |
| 55 | Struer | 18,040 ha |
| 56 | Stevns | 17,693 ha |
| 57 | Sorø | 17,128 ha |
| 58 | Odder | 15,557 ha |
| 59 | Lejre | 14,867 ha |
| 60 | Frederikssund | 14,057 ha |
| 61 | Kerteminde | 13,809 ha |
| 62 | Køge | 13,181 ha |
| 63 | Odense | 12,542 ha |
| 64 | Gribskov | 11,239 ha |
| 65 | Roskilde | 10,670 ha |
| 66 | Hillerød | 8,308 ha |
| 67 | Samsø | 8,193 ha |
| 68 | Ærø | 6,615 ha |
| 69 | Egedal | 6,224 ha |
| 70 | Fredericia | 5,626 ha |
| 71 | Læsø | 5,521 ha |
| 72 | Fredensborg | 4,193 ha |
| 73 | Halsnæs | 3,905 ha |
| 74 | Helsingør | 3,537 ha |
| 75 | Tårnby | 2,914 ha |
| 76 | Høje-Taastrup | 2,913 ha |
| 77 | Greve | 2,298 ha |
| 78 | Allerød | 2,120 ha |
| 79 | Solrød | 2,107 ha |
| 80 | Fanø | 1,881 ha |
| 81 | Furesø | 1,137 ha |
| 82 | Ishøj | 1,028 ha |
| 83 | Rudersdal | 924 ha |
| 84 | Hørsholm | 532 ha |
| 85 | Dragør | 423 ha |
| 86 | Lyngby-Taarbæk | 398 ha |
| 87 | Ballerup | 389 ha |
| 88 | Albertslund | 298 ha |
| 89 | København | 180 ha |
| 90 | Vallensbæk | 73 ha |
Method and caveats
How the figures are calculated
Declared area is allocated by proportional overlap and largest remainder. A field is counted once in the municipality containing its largest overlap.
Effective crop diversity is exp(Shannon), calculated from classified area in the broad editorial crop groups.
All years use the pinned 2026 DAGI municipality boundaries. The national figure is calculated from unique fields and is not the sum of municipalities.
The crop groups are openlanddata presentation groups, not an official SGAV classification.
The figures describe aggregate declared areas for each year and cannot be used to track crop rotation on individual fields.
Sources and terms
Use the data yourself
CC0 1.0 · You may copy, adapt and share the data, including commercially. Credit is good practice, but is not required by CC0.
Suggested credit: SGAV, Marker
CC0 is documented in the official catalogue for the WFS layer. Its application to the matching ZIP file has not been separately confirmed.
Terms reviewed: 2026-09-07. Processing and calculations: openlanddata.Use the data yourself
CC BY 4.0 · You may copy, adapt and share the data, including commercially. Credit the source, link the licence and describe your changes.
Attribution: Klimadatastyrelsen · DAGI · CC BY 4.0
Municipal snapshot retrieved on 15 July 2026. Boundaries and municipality assignment are used in our calculations.
Terms reviewed: 2026-09-07. Processing and calculations: openlanddata.crop-pulse-collection:marker:3ea695a370bbe768c077dcbfdb3f248ef34aee0154bdca56812df0c2f156ac99