
Key figures
- Declared field area
- 924 ha 2026
- Fields
- 378 2026
- Average field size
- 2.5 ha
- Median field size
- 1.2 ha
- Effective crop diversity
- 3.1 effective groups
- Largest crop group
- Grass and fodder 58%
Landscape around the fields · 2024
Developed land and infrastructure and Forest · 67.1 % of the municipality.
- Developed land and infrastructure43.9 %Denmark: 13.9 %
- Forest23.2 %Denmark: 13.3 %
- Agricultural land10.2 %Denmark: 57.6 %
- Inland water9.7 %Denmark: 2.6 %
- Wet nature5.0 %Denmark: 5.7 %
- Other artificial areas2.9 %Denmark: 0.7 %
- Dry and open nature2.4 %Denmark: 3.6 %
- Sea and transitional waters<0.1 %Denmark: 0.3 %
- Terrestrial unclassified
- 2.8 %
- Unavailable coverage
- 0.0 %
Complete boundary area: 7,337.7 ha. Shares include water, unclassified land and unavailable coverage.
All figures
| Land-cover type | % | Denmark % |
|---|---|---|
| Developed land and infrastructure3,224.0 ha | 43.9 % | 13.9 % |
| Forest1,700.6 ha | 23.2 % | 13.3 % |
| Agricultural land746.2 ha | 10.2 % | 57.6 % |
| Inland water708.8 ha | 9.7 % | 2.6 % |
| Wet nature367.8 ha | 5.0 % | 5.7 % |
| Other artificial areas210.0 ha | 2.9 % | 0.7 % |
| Dry and open nature175.7 ha | 2.4 % | 3.6 % |
| Sea and transitional waters1.3 ha | <0.1 % | 0.3 % |
| Terrestrial unclassified203.4 ha | 2.8 % | 2.3 % |
| Unavailable coverage0.0 ha | 0.0 % | <0.1 % |
Source and calculation
OpenLandData calculates these areas from native 10-metre cells within the complete DAGI municipality boundaries. The reference year combines sources of different dates.
Denmark: area-weighted shares within the 98 complete municipality boundaries. These mapped areas use a different definition and boundary denominator from the official land accounts and declared field areas.
The source is Aarhus University's Basemap05 map for 2024, which combines information from different dates. Categories describe land-cover types, not legal protection or the condition of nature. The map cannot be used for legally binding land-use decisions.
Aarhus University / Gregor Levin, Basemap05 (2024), DOI 10.5281/zenodo.22197260. Levin (2025), DCE Technical Report 363. CC BY 4.0. Grouping, polygonisation, display reprojection and area summaries by OpenLandData.
Crop composition
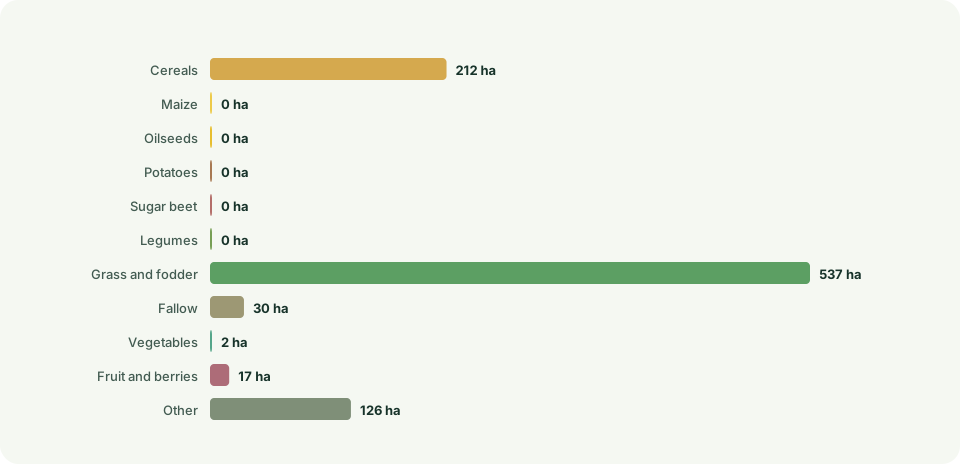
| Crop groups | Declared field area | Share |
|---|---|---|
| Grass and fodder | 537 ha | 58.1% |
| Cereals | 211.7 ha | 22.9% |
| Other | 126.1 ha | 13.6% |
| Fallow | 30.4 ha | 3.3% |
| Fruit and berries | 17.2 ha | 1.9% |
| Vegetables | 1.6 ha | 0.2% |
| Maize | 0 ha | 0% |
| Oilseeds | 0 ha | 0% |
| Potatoes | 0 ha | 0% |
| Sugar beet | 0 ha | 0% |
| Legumes | 0 ha | 0% |
Development over time
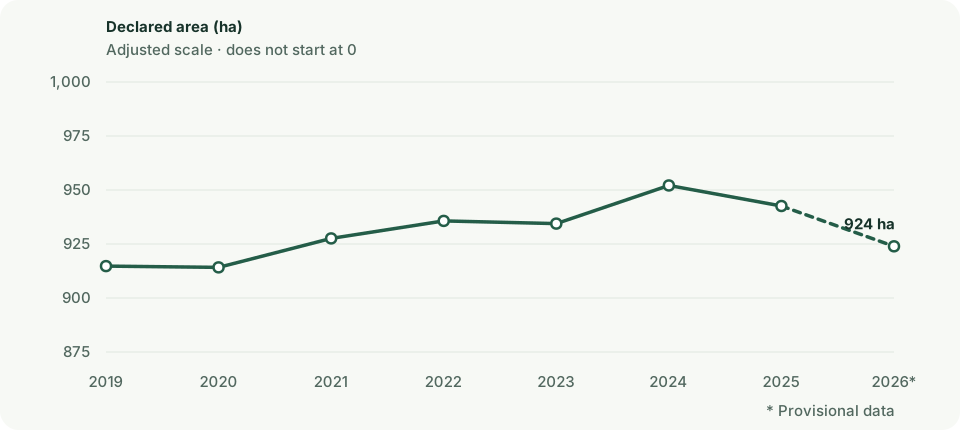
Declared area rose by 1% between 2019 and 2026. This describes declarations and does not by itself establish a change in land use. The municipality accounted for 0.03% of nationally declared agricultural area in 2026.
| Year | Declared field area | Fields | Classification coverage |
|---|---|---|---|
| 2019 | 914.8 ha | 339 | 100% |
| 2020 | 914.2 ha | 337 | 100% |
| 2021 | 927.6 ha | 333 | 100% |
| 2022 | 935.7 ha | 341 | 100% |
| 2023 | 934.4 ha | 368 | 100% |
| 2024 | 952.1 ha | 387 | 100% |
| 2025 | 942.6 ha | 382 | 100% |
| 2026 | 923.9 ha | 378 | 100% |
Position among municipalities
- Declared field area
- No. 83 of 90
- Field count
- No. 81 of 90
- Crop diversity
- No. 79 of 84
- Average field size
- No. 83 of 84
More perspectives on the municipality
Explore organic farmland, small biotopes, lowland soils and land projects. Open a dataset to see the municipality summary and the areas on the map.
Organic farmland
Explore recorded organic areas and their share of the municipality’s total area.
Explore in this municipality→2026 · Provisional dataDeclared small biotopes
Explore declared small biotopes. These records do not represent all nature areas in the municipality.
Explore in this municipality→Kulstof2022Carbon-rich lowland soils
Explore mapped soils and the distribution of soil carbon classes in the municipality.
Explore in this municipality→September 2026MARS projects
View registered land projects and their status. A registered project is not necessarily completed.
Explore in this municipality→These datasets cover different periods and may overlap. Their areas cannot be added together or treated as shares of the agricultural area above.
Method and caveats
How the figures are calculated
Declared area is allocated by proportional overlap and largest remainder. A field is counted once in the municipality containing its largest overlap.
Effective crop diversity is exp(Shannon), calculated from classified area in the broad editorial crop groups.
All years use the pinned 2026 DAGI municipality boundaries. The national figure is calculated from unique fields and is not the sum of municipalities.
The crop groups are openlanddata presentation groups, not an official SGAV classification.
The figures describe aggregate declared areas for each year and cannot be used to track crop rotation on individual fields.
Sources and terms
Use the data yourself
CC0 1.0 · You may copy, adapt and share the data, including commercially. Credit is good practice, but is not required by CC0.
Suggested credit: SGAV, Marker
CC0 is documented in the official catalogue for the WFS layer. Its application to the matching ZIP file has not been separately confirmed.
Terms reviewed: 2026-09-07. Processing and calculations: openlanddata.Use the data yourself
CC BY 4.0 · You may copy, adapt and share the data, including commercially. Credit the source, link the licence and describe your changes.
Attribution: Klimadatastyrelsen · DAGI · CC BY 4.0
Municipal snapshot retrieved on 15 July 2026. Boundaries and municipality assignment are used in our calculations.
Terms reviewed: 2026-09-07. Processing and calculations: openlanddata.crop-pulse-collection:marker:3ea695a370bbe768c077dcbfdb3f248ef34aee0154bdca56812df0c2f156ac99